
Liquidity is a Network. Not a Number
By Jeremie Feuillette (Managing Director, Global Head of Liquidity Optimisation Solutions)
Tariffs don’t just make things more expensive. They disrupt networks. And when networks break, everything slows down.
Earlier this year, Donald Trump’s return to the campaign trail came with familiar rhetoric: sweeping tariffs on China and potentially other trade partners. The headlines weren’t just about politics. They were about flow—the flow of goods, components, and raw materials.
When a single tariff is imposed on, say, a microchip made in Southeast Asia, the effects ripple. That chip might be used in a German sensor, which ends up in a Canadian machine, which fuels a U.S. construction site. One constraint. Global shockwaves.
The same is true for liquidity across modern payment systems.
We tend to treat liquidity as a number on a screen. But that number is meaningless without context. Liquidity isn’t static. It moves. It connects. It enables. And that makes it a network.
Network Analytics: The Quiet Revolution in Liquidity Monitoring
Treasury and risk professionals have long been trained to watch balances, track exposures, and run stress tests. But all too often, these are done in isolation. One team watches GBP. Another watches USD. Some monitor payment systems. Others keep an eye on margin calls.
But none of this sees the whole.
What if, instead, you could see the entire liquidity system as a network? What if, rather than watching totals, you could watch flows? And rather than tracking static metrics, you could analyse relationships between accounts, entities, and systems?
That’s what advanced financial network analytics makes possible. It transforms liquidity from a collection of moving parts into a living map. And when you can see the map, you can see the patterns. The risks. The leverage points.
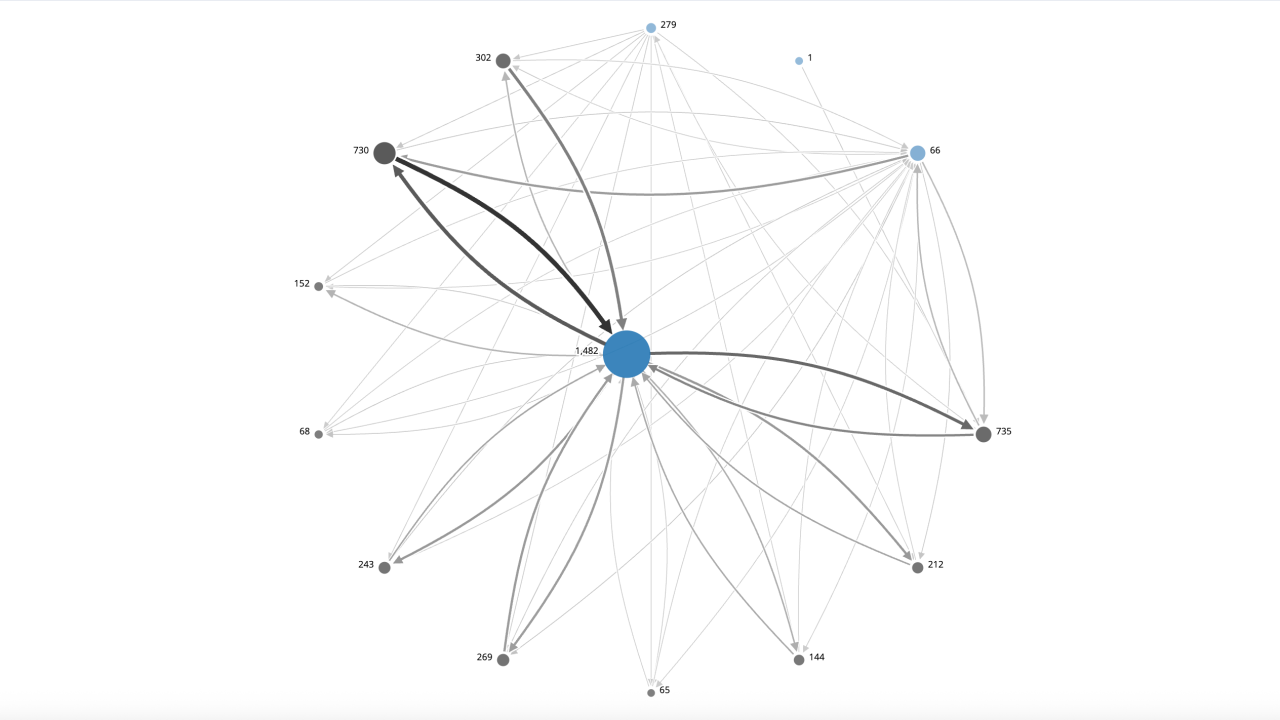
In Network Theory and Financial Risk, Dr. Kimmo Soramäki shows how financial institutions are embedded in directed, weighted networks of payments. This means every movement of cash from one node to another isn’t just a transaction—it’s a signal. A dependency. A potential risk.
Network analytics allow us to interpret those signals. To see, in real time, which nodes are structurally central, which accounts act as bottlenecks, where liquidity consistently pools, where inflows and outflows are mismatched, and how dependencies evolve throughout the day.
It’s not just a new lens. It’s a new language. And it reveals the kind of vulnerabilities that standard dashboards simply don’t.
Why Does This Matter? Because Risk Hides in Structure
Let’s take a simple example: two subsidiaries in the same banking group.
On paper, they’re funded. But in practice, one is net-paying while the other is net-receiving. Without visibility of the link between them, Group Treasury may overfund both—tying up unnecessary capital. Or worse, they may miss that one subsidiary is chronically delaying payments because it’s unknowingly funding the other.
Now zoom out. Imagine this pattern across 200 legal entities, 15 currencies, 12 time zones, and 8 market infrastructures.
That’s today’s reality for global banks.
Financial network analytics surfaces these patterns. It shows where liquidity is trapped. Where entities are too dependent on a single corridor. Where your supposed intraday liquidity is only available on paper—but not in practice.
It also highlights single points of failure. In a directed graph of payment flows, some nodes have disproportionate importance. If they go down, the entire structure can seize up. Identifying these nodes—and planning around them—is now possible.
And we’ve seen this happen. During the early days of the COVID-19 pandemic, central banks noted that despite historically high reserves, banks were reluctant to release liquidity. Why? Because they couldn’t see where the risk was concentrated. And in a network, opacity equals caution.
Seeing What You Couldn’t See Before
Network analytics reveals things that traditional tools cannot. For example:
Sink nodes: Accounts that receive liquidity but never send it on, causing imbalance.Source imbalance: Corridors where inflows and outflows are consistently misaligned.
Cyclical dependency: Payment loops where A funds B, who funds C, who funds A.
Temporal clustering: Multiple high-value payments scheduled at the same time, unintentionally spiking liquidity usage.
More than anything, it shows you that liquidity isn’t a pool. It’s a pulse.
And it brings to light a simple truth: just because you have liquidity doesn’t mean it’s usable. Not when it’s stuck in the wrong node. Not when it’s scheduled at the wrong time. Not when it’s dependent on flows that haven’t yet arrived.
These structural blind spots cost real money. In one case study, mapping internal flows at a multinational bank revealed that over 20% of its intraday buffer was routinely consumed by avoidable mismatches between predictable internal flows.
The Shift From Monitoring to Understanding
Most current systems monitor. They alert when balances fall. When thresholds are breached. When flows deviate.
But Intelligent Liquidity Optimization (ILO) helps you go a step further: it explains why.
Not just that liquidity is short in an account, but that it’s short because another account upstream is consistently late. Not just that volatility is up, but that it’s always triggered when a particular corridor is active. Not just that a payment failed, but that the failure disrupted three dependent flows.
This is what makes it a game-changer.
It transforms treasury from a control function into a diagnostic and strategic hub. It equips teams with evidence, foresight, and leverage. It turns static dashboards into live maps. And it gives CFOs and CROs a new kind of visibility:
For the CFO, this means understanding where excess liquidity is trapped and safely redeploying it.
For the CRO, it means proactively identifying liquidity choke points before they become headlines.
For the COO, it means fewer operational surprises and a smoother payment rhythm.
A New Literacy for Liquidity
In the same way that supply chain professionals now think in terms of interdependencies and critical nodes, liquidity managers need to start thinking in flows, structures, and graphs.
This shift is not about buying more tools. It’s about learning to read the system differently.
Liquidity doesn’t fail because one account is low. It fails because multiple dependencies collide. Risk doesn’t emerge in isolation. It accumulates silently in the network. Optimizing for cost without seeing structure often increases hidden fragility.
Network analytics offers a way out of that blindness.
It gives risk, treasury, and IT professionals a shared foundation—a way to talk about liquidity in terms of what it really is: a living, moving, complex adaptive system.
This Is Just the Beginning
We haven’t even talked about optimization yet. Or automation. Or stress simulation.
This piece isn’t about the solutions. It’s about seeing the problem clearly for the first time.
Liquidity is not a balance. It’s not a number. It’s not static. It’s a network. And now we can see it.
Let’s start managing it with the intelligence it deserves.
To learn how treasury teams can move from static monitoring to dynamic optimization, explore FNA’s Intelligent Liquidity Optimization (ILO) Solution.